Introducing Unity Gateway Insights
Introducing Unity Gateway Insights
Databricks releases Unity Gateway Insights to automatically analyze millions of agent tracking data, revealing cost waste points such as MCP errors, inefficient model usage, and redundant workflows.
When looking to cut AI costs, teams often start with budgets or open-source models. But agent traces can reveal other opportunities to save. At Databricks, trace analysis surfaced several: offline replays showed no performance gain from upgrading from Opus 4.8 to Opus 5, so we stayed on the cheaper 4.8; fixing common MCP errors recovered an estimated $1.2M in costs a year; and traces showed that simple prompts were going to expensive models, prompting us to adopt Smart Routing.
Today, we’re introducing Unity Gateway Insights, which automatically uses Genie to analyze millions of agent traces alongside your business data and ontology. It surfaces where tokens are being wasted: MCP errors that keep recurring, simple tasks running on expensive frontier models, and repeated workflows worth turning into shared skills, all in the context of your business and under the same governance as your other data.
How Insights works
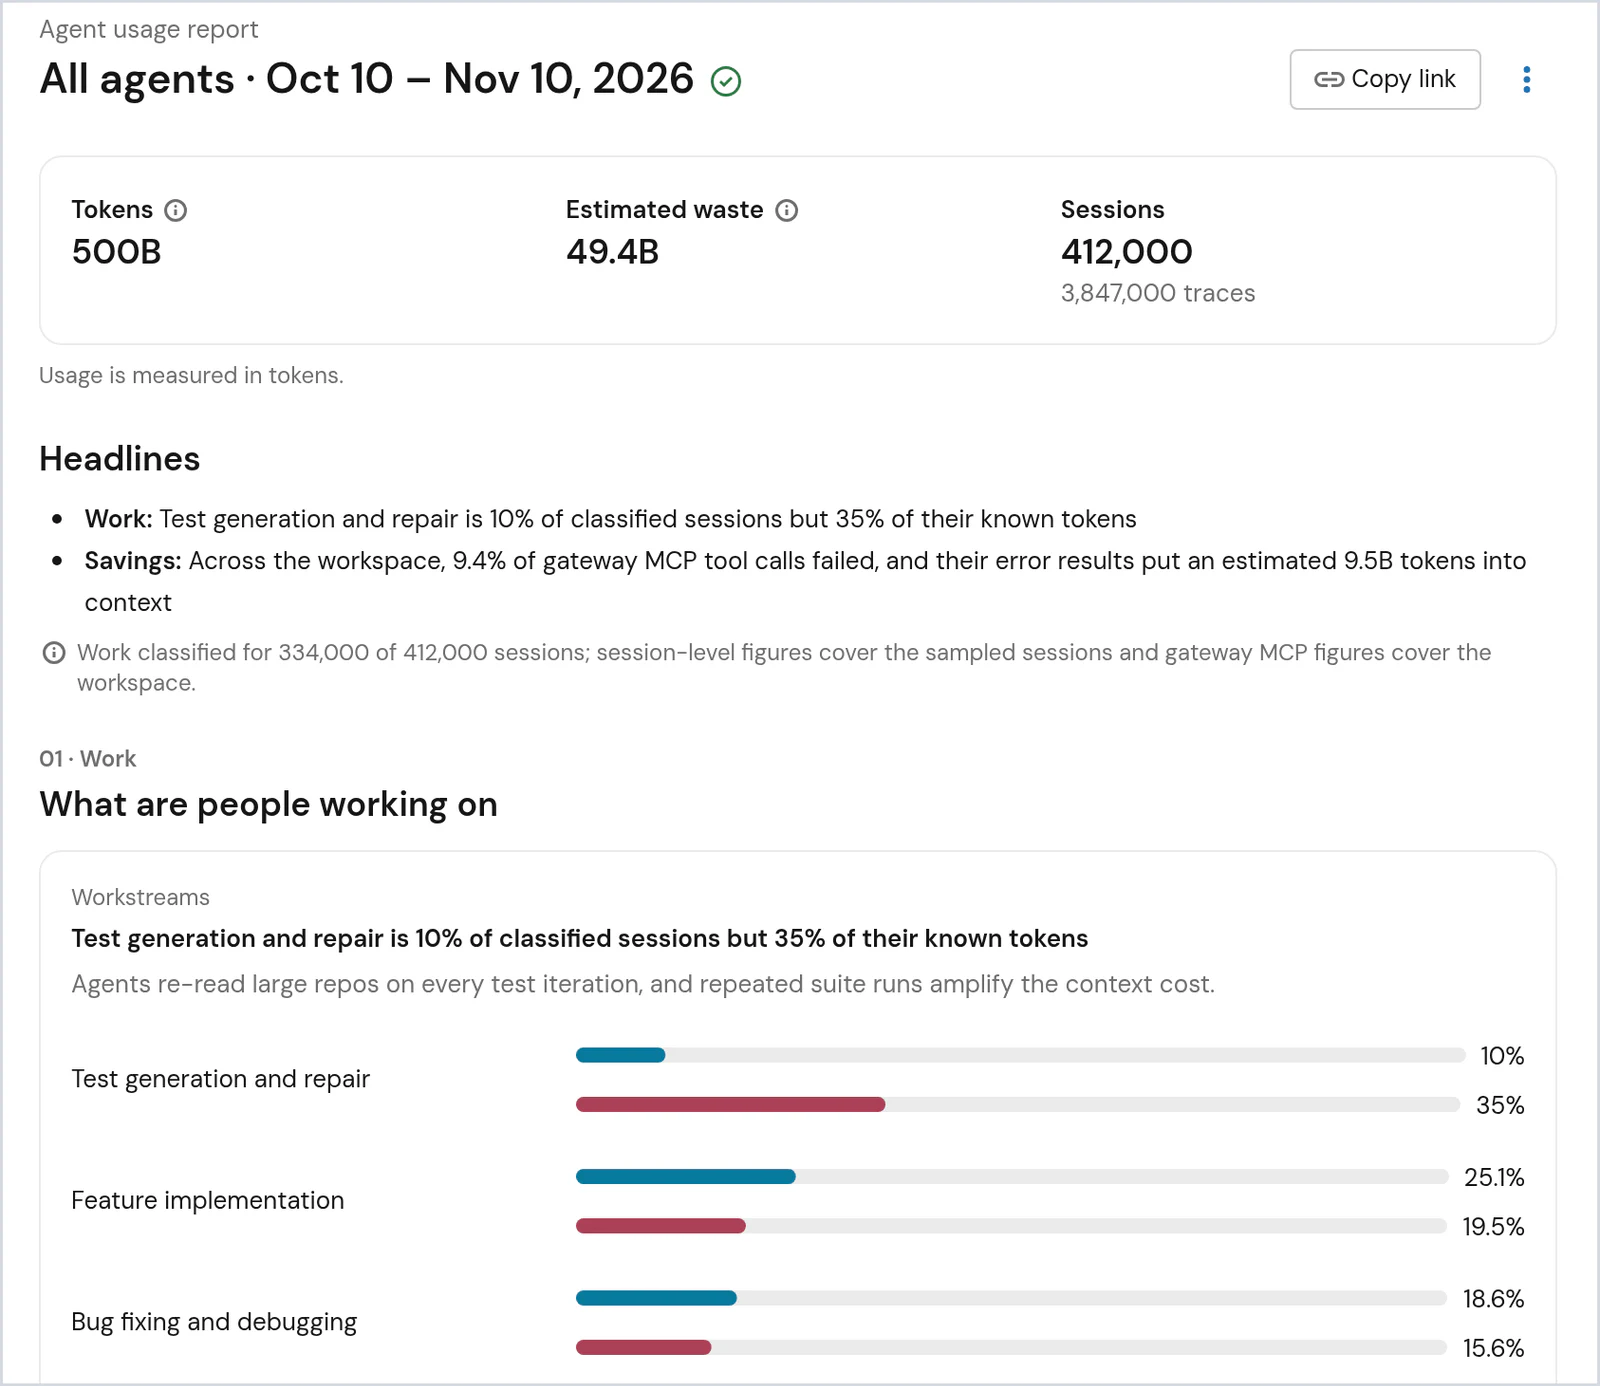
If you already have traffic flowing through Unity Gateway, open AI Gateway > Observability > Insights and generate a report for the last day, 7 days, or 30 days. Insights then writes a report on the tokenomics of your coding agent rollout that answers the following questions:
- What are people working on? Insights compares each workstream's share of sessions with its share of tokens. A workstream with 10% of sessions and 35% of tokens is the first place to look.
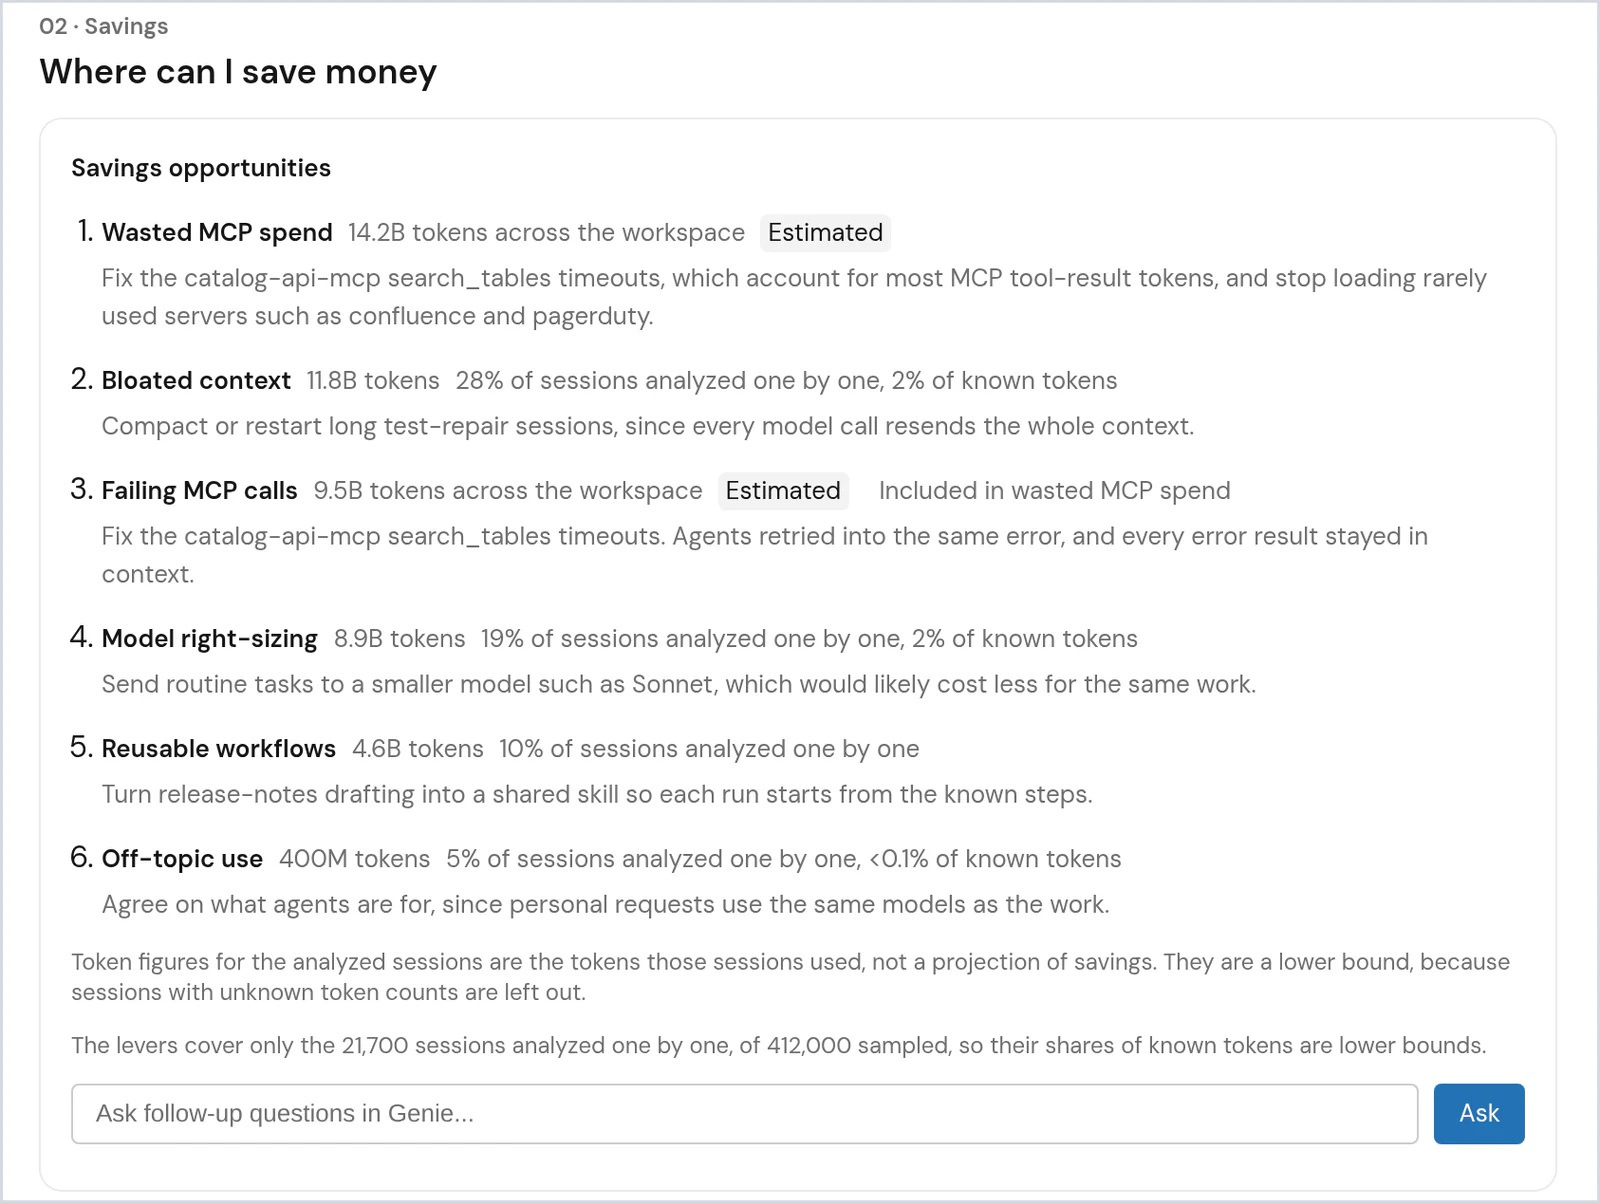
- Where can I save money? Insights shows where tokens go and ranks each kind of waste by what it costs. For each repeated workflow, Insights writes a prompt you can copy to turn that workflow into a shared skill.
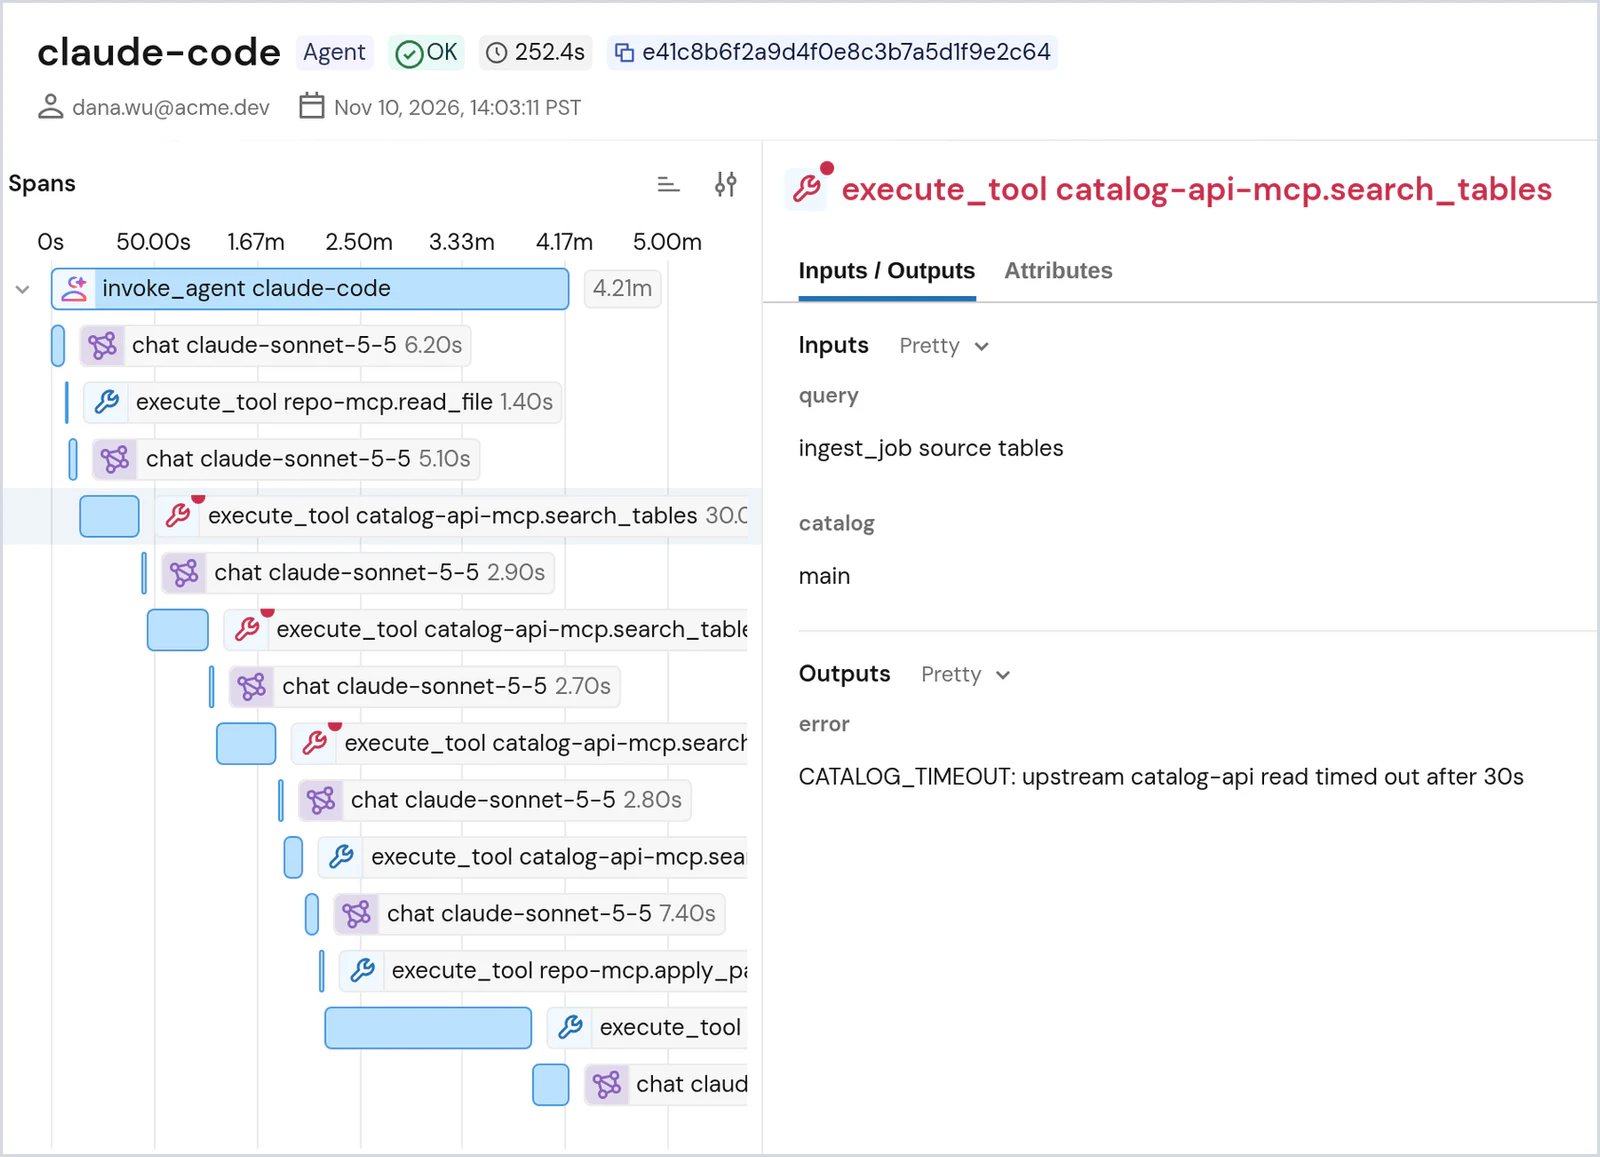
Each finding links to example sessions, so you can open the traces behind it.
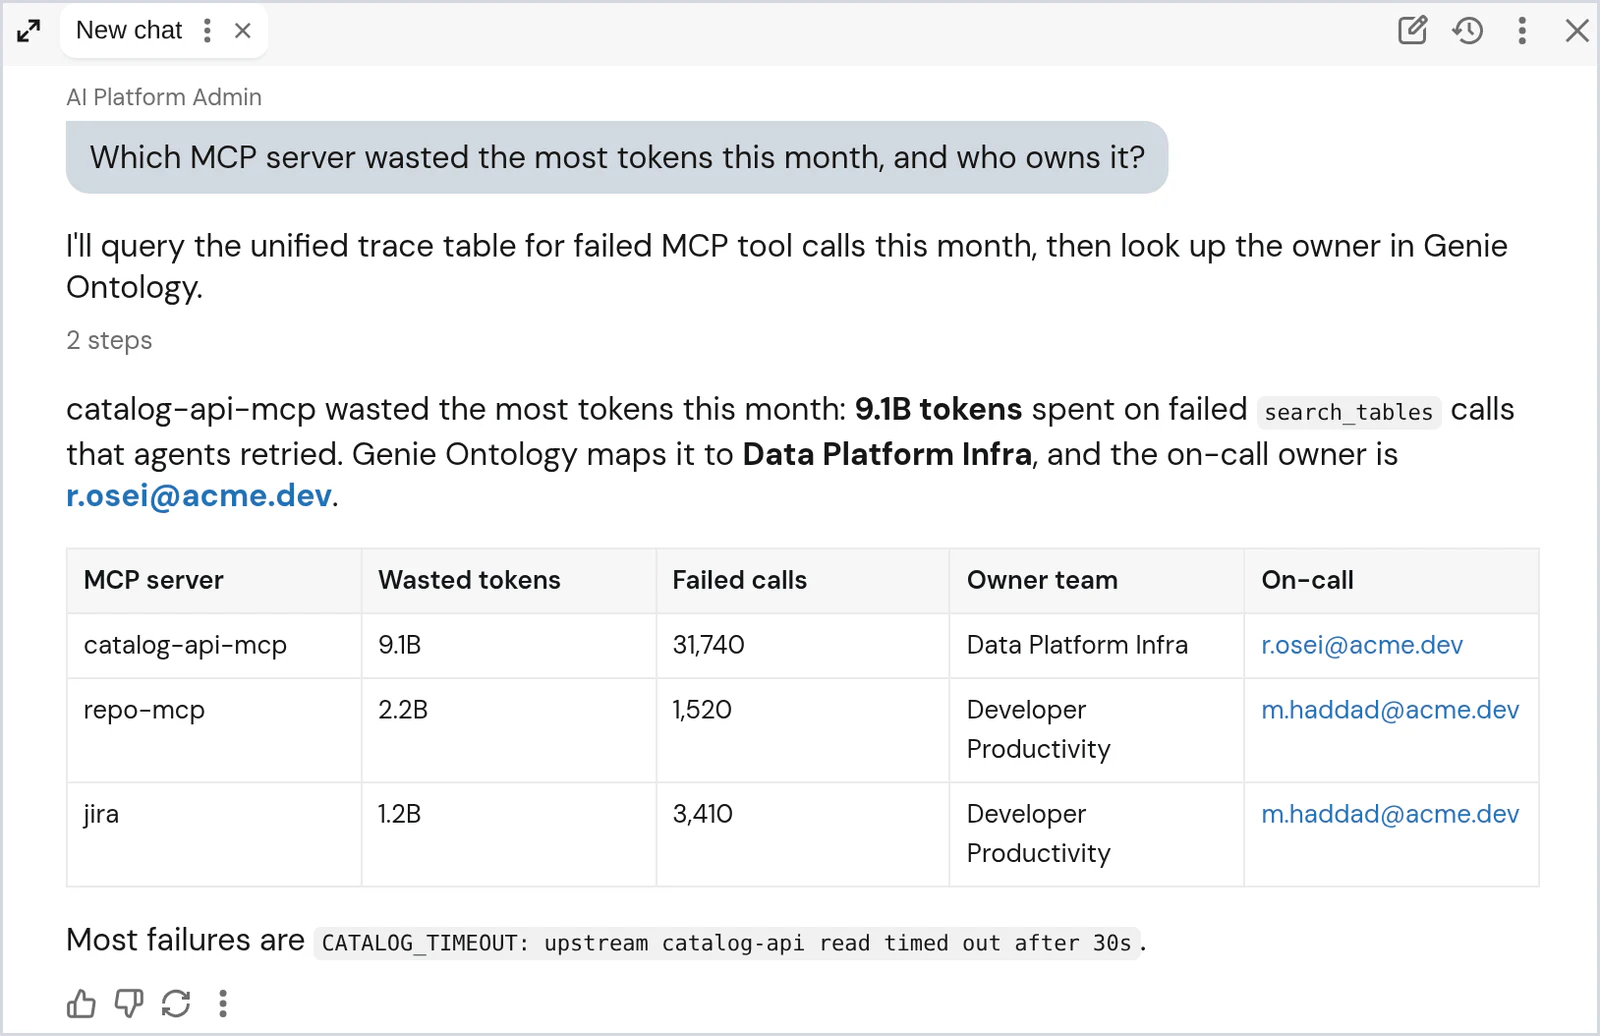
You can add up to 10 questions of your own to a report, such as whether the newest model is worth it for your team's work. To dig further, continue the conversation with Genie. Ask which MCP server wasted the most tokens this month and who owns it, and you have a bug report ready to send.
What Insights finds in your traces
Here's what's behind each kind of waste Insights reports:
- MCP Errors & Waste: When a tool call fails, agents retry or work around it until the task gets done, so the session looks like it worked while you pay for every retry. The $1.2M we found came from just seven small bugs in our MCP servers: $499K in wasted tokens plus 12,000 hours of engineers waiting on agents. Fixing all seven took about an hour.
- Inefficient Model Usage: Insights rates how complex the task was in each frontier-model session and counts the quick, routine ones, along with the tokens they used. Those are the sessions Smart Routing can send to a cheaper model while keeping frontier models for the work that needs them.
- Common workflows to codify: A workflow counts when it recurs in at least three sessions or across two engineers. A shared skill gives agents those steps up front, so you stop paying for them to work the steps out again every session.
The AI control plane on your data platform
Finding this kind of waste requires a full record of every step of every agent session: inputs and outputs, tool calls, subagents, intermediate steps, latency, and token cost. A standalone gateway records only the requests that pass through it. Capturing the rest of each session means instrumenting every coding agent yourself, then exporting the traces to a data platform to analyze them.
Pointing Claude Code at those traces still leaves you to design the investigation yourself, with no map of your business like the Genie Ontology provides. Insights runs the investigation we developed while rolling out coding agents to thousands of Databricks engineers. It samples sessions and groups them into workstreams by kind of work. Then it checks each workstream for failing MCP tools, bloated context, frontier models on simple tasks, and repeated workflows, and ranks what it finds by the tokens at stake. It depends on four things a standalone gateway can't have:
- Every agent traced automatically. Unity Gateway is the control plane your coding agent requests go through. When engineers launch Claude Code, Codex, or GitHub Copilot with the ug CLI, ug turns on each agent's own OpenTelemetry tracing automatically, so your teams have nothing to instrument. Traces land in the unified trace table, a governed Delta table in Unity Catalog that you own, in an open format any tool can read.
- Genie that knows your business. Genie writes the SQL and reads the sessions. With Genie Ontology, its answers use your own project names and business nuances.
- Scale for millions of traces. Databricks SQL queries your full trace history with the same scale and performance it brings to your largest tables.
- Locked down by default. Traces hold prompts, code, and tool output, so only the table's owner can query it until admins grant access with Unity Catalog grants and row filters. Insights reads the table in place, so you never export your most sensitive data to analyze it.
Get started
If your developers already run coding agents through Unity Gateway, you can generate your first report today:
- Set up the unified trace table so Unity Gateway records traces.
- Have your teams launch their coding agents with the ug CLI.
- In your workspace, open AI Gateway > Observability > Insights and generate a report. See the Insights documentation for details.
Source: Databricks Blog · databricks.com