Genie ZeroOps 正式进入公测:一个可自主修复数据管道的智能体,基于 8 万个客户问题的经验
Genie ZeroOps, now in public beta: An autonomous agent that fixes data pipelines, with lessons from 80,000 customer issues
Genie ZeroOps 已进入公测,可自主检测、调查和修复数据管道问题,新增收件箱共享、通知、一键创建 PR 等功能以帮助数据团队更快处理问题,基于 8 万个客户问题的经验。Genie ZeroOps 通过五步流程(检测、调查、验证、通知、修复)自动化处理问题,并支持添加自定义业务指令以遵循特定公司工作流程。
In June we introduced Genie ZeroOps, an autonomous agent that detects, investigates, and resolves data pipeline issues, such as upstream schema changes or data quality anomalies. Based on extensive private preview testing with hundreds of customers, we’ve added new features to help data teams triage issues faster - including inbox sharing, notifications, one-click PR creation, and the ability to add custom business instructions to follow specific company workflows. Today, Genie ZeroOps is available in Public Beta, and your workspace admin can turn it on from the workspace Previews page.
How ZeroOps triages a data pipeline issue
Data engineering teams are underwater, managing many thousands of pipelines a day. Some pipeline failures are easy to find and fix - a job fails, a pipeline update errors out, and someone gets paged. Others are silent - a table stops updating, or last night's load arrives with half its usual rows, and nobody notices until a dashboard shows the wrong number.
Either way, the work that follows typically looks the same: a notification is sent, an engineer spends the next few hours manually investigating logs, upstream tables, and related assets, and finally a PR gets generated with the fix.
Genie ZeroOps automates this entire manual workflow while maintaining security, governance, and recommendation quality, specifically guiding teams from initial issue alert to a pull request across five core steps:
- Detect: Continuously monitor jobs, pipelines, and tables for failures. Detect both hard job failures with jobs monitoring and silent data freshness and completeness issues with data quality monitoring.
- Investigate: Gather context across logs, source code, table metadata, and lineage. Run SQL queries to pinpoint root causes, recommend fixes, and prioritize insights by downstream impact.
- Verify: Test proposed fixes using unit tests and dry runs in a sandbox to safely validate hypotheses before applying changes.
- Notify: Send alerts to Slack, Teams, or PagerDuty with a summary of the issue and recommended fix. Filter out low priority issues to help teams focus on urgent matters.
- Remediate: Propose a code fix, and for Git-backed Jobs, automatically create a PR with pre-populated details.

What do teams need to resolve pipeline issues faster?
During the limited private preview, ZeroOps observed over 80,000 real customer issues across hundreds of companies, highlighting just how painful pipeline maintenance has become. We found that over half of issues require organization-specific knowledge to properly triage, rank, and resolve, which speaks to the fundamental need for custom context. Through this feedback, we identified and built several critical features every team needs to succeed with ZeroOps:
Do-it-Yourself solutions fall short at scale
During our private preview, we spoke with customers who were prototyping internal AI triage tools. We learned that while building a simple prototype has become easier, scaling automated triage across production environments introduces complex operational challenges that compound over time:
- System maintenance: Monitoring a system that manages thousands of pipelines across multiple teams requires constant upkeep, tracking service level agreements, and coordinating notifications among diverse stakeholders.
- Governance and security: Effective triage requires access to source repositories, data tables, and internal tooling. Safely configuring user and agent access levels across these systems at scale is a significant challenge.
- Custom context expansion: Actionable AI recommendations require custom context like documentation, tribal knowledge, and historical behaviors. Ingesting, expanding, and managing this context is difficult to scale.
- Accuracy and drift: Context bloat can lead to hallucinations or reduced accuracy over time. Maintaining evaluation suites and monitoring recommendation quality requires ongoing engineering investment.
Genie ZeroOps handles these complexities natively - leveraging direct access to your Unity Catalog, metadata, and pipeline lineage to resolve issues with full context.
Get started today
Try ZeroOps out for yourself! Have a workspace admin enable the ZeroOps feature. Then find the ZeroOps banner on the top of the pipelines page:
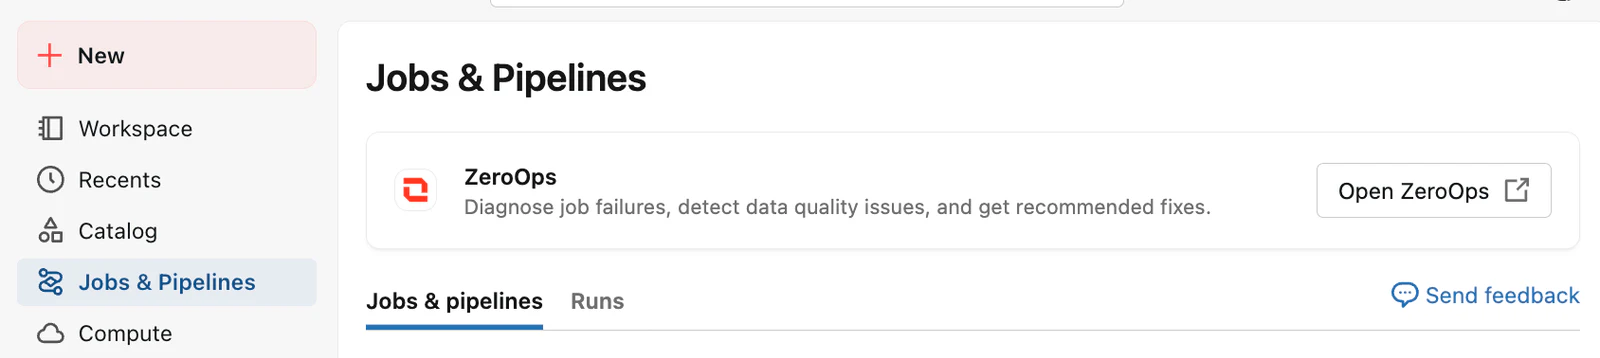
Read the documentation here for more details on how to get started.
If your team needs help onboarding ZeroOps to production, reach out to your account team to inquire about any workshops that we offer.
Frequently asked questions
Can Genie ZeroOps make direct changes to my pipeline?
No, ZeroOps will never change your code or data without your direct approval. Today, it investigates the failure, proposes a fix and can push that fix to a new branch for a pull request. It never changes production code or data without a person reviewing it first.
How does ZeroOps detect silent data quality issues?
It uses Data Quality Monitoring to flag tables whose commits arrive unusually late (freshness) or whose row counts fall below the expected range (completeness).
How is ZeroOps different from asking a coding agent like Claude Code to debug a failure?
ZeroOps automatically triggers as soon as an issue is detected, without a prompt, so the analysis is ready before anyone looks. It also has built-in access to run history, Unity Catalog lineage, Delta history and DQM signals, and it works within your Unity Catalog permissions.
What data does ZeroOps read, and where is it processed?
From the documentation, It reads run logs, source code, upstream table metadata and samples, while respecting Unity Catalog permissions. It uses models hosted by Databricks inside our security perimeter. Model calls stay in your workspace's region, and the model provider doesn't retain prompts or responses.
Can I stop ZeroOps from alerting me about expected failures?
Yes. Add a custom instruction to filter out unwanted notifications, or mark an insight as "not an issue."
来源: Databricks Blog · databricks.com